Cross Court Analytics: How an NSL match is won – A data-driven look at the patterns that helped the Newport Dragons defeat the Chicago Grizzlies.
Written by Jesse Mills, Cross Court Analytics
The opening match of the NSL North Division 2024 had all the makings of a cracking evening, and it absolutely lived up to the expectation. Going into the decisive third period the score was tied 1-1, with the Dragons eventually coming out on top. The lineups contained a fantastic range of players featuring American stars Andrew Douglas and Todd Harrity for the Grizzlies, with Ramit Tandon and Spencer Lovejoy taking top billing for the Dragons. All four are excellent, well-rounded players but we will make special note of the third listed players for each team. The Dragons had the Malaysian pocket rocket Sanjay Jeeva, known for his attacking flair and no-look reverse boast, while the Grizzlies had the English behemoth, Mark Broekman. Both could scarcely be more different, in playing style, handedness (Jeeva is left handed, a note that will come up frequently), and height (Broekman is 9 inches taller). These differences show the diversity of strategy available in the NSL, not just on court but off-court drafting and team selection too.
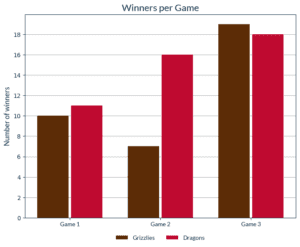
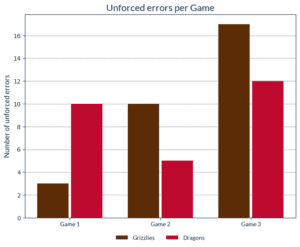
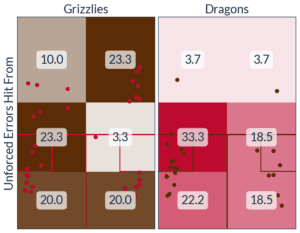
Rather than going game by game, play by play, we will look at wider comparisons between the teams, and what better place is there to start answering ‘how the match was won’ than by looking at the crucial winner/unforced error numbers. Quite simply, the Dragons hit more winners and made fewer unforced errors than their opponents, which goes a long way to explaining why they came out on top. The Dragons hit 45 winners to 36 for the Grizzlies, while making just 27 unforced errors to the Grizzlies’ 30, showing that their attacking selection approach paid off.
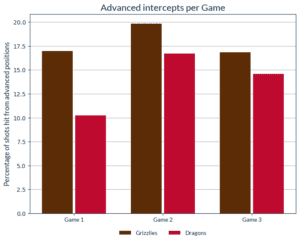
Hitting more winners suggests your play is more attacking, and this can be seen in how often each team hit the ball from the front of the court, i.e. how often their opponents took the ball in short. The Grizzlies hit 18% of shots from advanced positions compared to just 14% for the Dragons, with Newport hitting more from mid and deep as would be expected.
What happened when the ball went short? Both teams opted to straight counter-drop over 30% of the time, as shown below. Chicago was more successful in getting the ball to deep from the front, with Newport having more balls reach more mid-court – perhaps this was attacking play to get the ball bouncing twice quickly, or maybe a factor of the wingspan of Broekman and the Grizzlies intercepting more balls across the T.
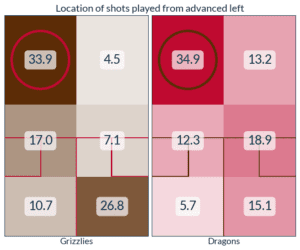
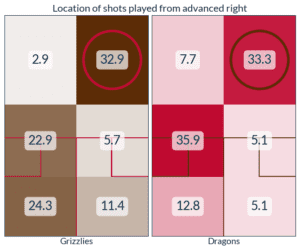
The Dragons counter better in the front however, hitting 33.4% of their winners from there (26.7% from the front left!), to the Grizzlies’ 31.3%; This is accentuated by the difference in how often the ball went short for each team, the Dragons hit more winners from this area despite hitting fewer balls from those positions. In addition, they made far fewer errors when playing any straight drop, 3 overall where Chicago hit 6 unforced straight drop errors per side!
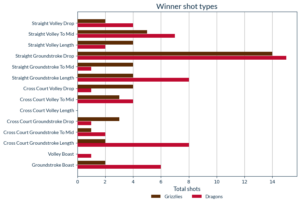
As well as the counter drop, the Dragons also used the boast regularly (a Jeeva special) to take the ball into the front, around 7% of all shots compared to 2.5% for Chicago. While only 3 groundstroke boasts per side were winners for Newport, they dragged the Grizzlies forward allowing them to win rallies with shots to length. They hit 20 winners to length (8 straight, 8 crosscourt, 2 straight volleys) where the Grizzlies only managed 10 (4,2,4 respectively).
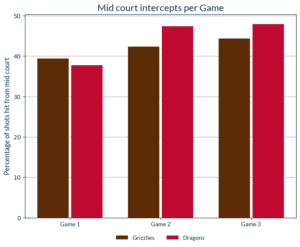
There are several stats that are generally indicative of who is winning a match, one of the most correlated being mid-court intercepts, i.e. who is staying closer to the T. Unsurprisingly Chicago led this in Period 1 which they won, but Newport improved this as they won periods 2 and 3, despite Chicago also hitting from mid-court more. Volleys may also indicate mid-court dominance but in this case the correlation is low, each team volleyed more often in the first period that they lost, although Newport closed out period 3 by volleying over 30% of shots, compared to 27% for Chicago.
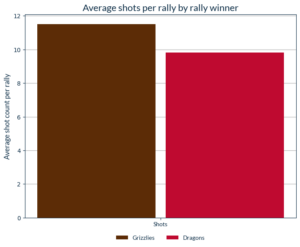
Less indicative but interesting to note are some stats that match the pattern of period winners. The Grizzlies cross-courted more in period 1, which they won, while the Dragons cross-courted more in periods 2 and 3, which they won. A longer average rally length suited Chicago, who won period 1 when the average rally was over 12 shots long, but lost periods 2&3 when the average rally length dropped below 10.
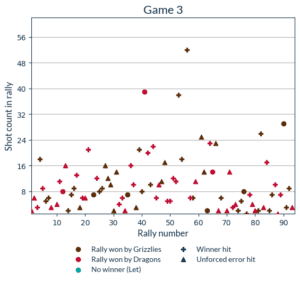
We hinted that Newport might have taken a more attacking approach, and while they hit more winners in periods 1&2, the Grizzlies actually outgunned them in the decisive final period. However, it is the unforced errors tell the real story here – every period was lost by a team that hit 5 or more unforced errors than their opponents. In particular, the ending of period 3 contains a large number of Dragons winners and Grizzlies errors as the team that is behind attempts to rattle off quick points to make up the difference late in the game.
This was a look at how the Newport Dragons defeated the Chicago Grizzlies in their first ever NSL match. The NSL provides a great spectacle as well as plenty of food for the analyst to work with, comprising strategy pre-court with the draft, off court with substitutions and powerplays, and on court with good old fashioned squash tactics, where Newport had the upper hand on the day. We look forward to more of this next season!

